

News subscription required to download the report. Please sign in if you wish to continue.
The solar market saw solar prices dropped drastically due to oversupply in 2011 and most solar firms across the supply chain suffered losses. Nevertheless, a significant drop in prices for solar PV systems stimulated new demand and total global installations still reached 26.1GW, a 30% growth on year. With growth is expected to slow to 9.4% this year, Digitimes Research examines the changing policies and demand trends in multiple solar markets, as well as providing a financial analysis of the concerns affecting the supply chain.
Abstract
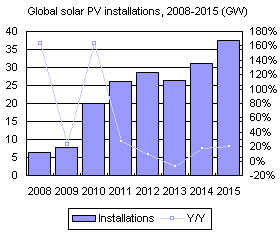
The solar market saw solar prices dropped drastically due to oversupply in 2011 and most solar firms across the supply chain suffered losses. Nevertheless, a significant drop in prices for solar PV systems stimulated new demand. Though the Europe market was plagued by a debt crisis, total global installations still reached 26.1GW, a 30% growth on year, and showed that demand was not as low as the market believed.
As for 2012, governments in Europe have been reconsidering solar incentive policies and plan to make cuts to subsidies. Major solar markets such as Germany, Italy, and France all face dwindling demand. However, many new markets such as Japan, China, India and the US have emerged due to cost reductions to the solar PV systems. Strong demand from these new markets may offset the impact of the dwindling markets in Europe. Digitimes Research estimates the 2012 solar market will experience installation growth of 9.4%, reaching 28.5GW.
Capacity expansions taken up by the solar firms in recent years have caused supply to significantly exceed demand. Hence, despite a continued increase in demand, the industry will likely continue to suffer due to oversupply. Price increases will not be easy, which means the undesirable market conditions will first impact firms that lack improved technologies and have relatively higher production costs. Asia-based firms (mainly in Greater China) will continue to increase their market share. However, the supply chain is not likely to get rid of an oversupply problem until 2014 when demand shows significant growth and excess capacity exits the market.
Table of contents
Chart 2: Global solar installation market share by region 2008-2013
Table 1: Annual targets of new solar PV system installations in Germany, 2012-2017 (MW)
Chart 5: Relationship between solar FIT degression and sytem price, 1Q07-3Q12 (EUR/kW)
Chart 8: Market share of solar PV systems in Italy by size, 2011 year-end
Table 3: Eligibility for obtaining FITs for solar PV systems on Italy farmland
Chart 10: Renewable energy targets and the Green Certificates system in Romania
Table 4: Solar FIT in Bulgaria, June 2011-June 2012 (EUR/kWh)
Table 5: 2020 Solar installation targets in emerging markets in Eastern Europe (MW)
Chart 11: Eastern Europe solar installations by country, 2009-2012 (MW)
Table 8: Adjusted fixed solar FIT for solar PV systems in Greece, 2012 (EUR/kWh)
Table 9: Residential solar PV system subsidy policies in Japan, 2011-2012
Table 10: Non-residential solar PV system FIT policies in Japan, 2011-2012 (JPY/kWh)
Table 12: Federal and local Solar installation targets and incentive policies in India
Table 13: FIT for solar PV systems in Gujarat, 2010-2013 (Rupee/kWh)
Chart 18: Large-size solar PV system development process in the US
Chart 20: Global solar PV market share by country, 2011-2012
Table 14: Global solar installations by region, 2010-2012 (MW)
Chart 21: Supply and demand for PV polysilicon, 2012 (k tons)
Chart 23: Spot price trends for solar cells and modules, July 2011 to February 2012 (US$/W, EUR/W)
Chart 26: Global solar market share by technology, 2011-2012
Chart 27: Global solar cell and wafer capacity at the end of 2011 (MW)
Table 15: Top ten global solar wafer makers by capacity, 2011 (MW)
Table 16: Top 10 global solar cell makers by capacity, 2011 (MW)
Chart 28: Conversion efficiency distribution of c-Si solar cells, 2011-2012
Chart 29: Increases in conversion efficiency for mainstream multi-crystalline solar cells, 2Q10-2Q12
Chart 30: Bankrupted solar firms in Europe and the US, 2011-2012

