
In the global touch panel market, handset applications will account for the highest proportion of shipments at 76.2% in 2012. In second-half 2012, the main change in the handset touch screen market is the release of Apple's iPhone 5 that uses in-cell touch screen technology. The supply chain for Apple's panels will be shifted from Taiwan-based panel makers to Japan and Korea- based ones, which will cause shipments for panels used in handsets to decrease for Taiwan-based panel makers from 41.3% in first-quarter 2012 to 26.9% in fourth-quarter 2012.
Additionally, China-based panel makers will benefit from low-priced handsets in China. Due to such handsets having strict cost requirements, they will be beneficial for China-based touch screen makers. This will allow the makers' shipments of touch panels used in handsets to increase from 32.7% in first-quarter 2012 to 39.4% in fourth-quarter 2012.
Tablet touch screen applications have seen the biggest growth in recent years and are bringing in more profit per panel due to their larger size compared with panels used in handsets. In 2012, the proportion of panel shipments used in tablets will be 8.4%. The biggest change in the tablet touch screen market will be Apple's 7.85-inch iPad, which uses double-layer ITO thin-film touch panels provided by Japan-based panel makers. Thus, Taiwan-based panel makers' global shipments for tablets will fall to 69% in fourth-quarter 2012 from 90.9% in first-quarter 2012.
In the second half of 2012, as Windows 8 is about to reach the market, Taiwan-based panel makers will proactively enter supply chains for PCs that use touch panels. Because Taiwan-based panel makers began cultivating OGS (one glass solution) panel technology relatively early, they will still see revenues from PC-use touch screens due to the panel area being larger in PCs compared with handsets, despite the penetration rate for projected-capacitive touch screen notebooks and all-in-one (AIO) PCs only reaching 1% in fourth-quarter 2012.
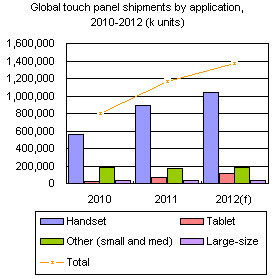
Chart 1: Global touch panel shipments by application, 2010-2012 (k units)
Chart 3: Taiwan touch panel shipments, by application, 1Q12-4Q12 (k units)
Chart 4: Taiwan touch panel shipments, by technology, 1Q12-4Q12 (k units)
Chart 5: Taiwan touch panel shipments, by maker, 1Q12-4Q12 (k units)
Chart 6: Taiwan touch panel shipments for handset applications, by technology,1Q12-4Q12 (k units)
Chart 7: Taiwan touch panel shipments for tablet applications under 11-inches, 1Q12-4Q12 (k units)
Chart 11: Taiwan touch panel shipments for PC application, by maker, 1Q12-4Q12 (k units)
Chart 12: China touch panel shipments, by application, 1Q12-4Q12 (k units)
Chart 13: China touch panel shipments, by technology, 1Q12-4Q12 (k units)
Chart 14: China touch panel shipments, by panel maker, 1Q12-4Q12 (k units)
Chart 15: China touch panel shipments for handset applications, by technology, 1Q12-4Q12 (k units)
Chart 16: China touch panel shipments for tablet applications, by maker, 1Q12-4Q12 (k units)
Chart 17: Taiwan touch panel shipments for tablet applications, by technology, 1Q12-4Q12, (k units)
Chart 19: New iPhone's embedded touch panel share, by supplier,
Chart 20: Large size touch panel shipments, by application and technology, 2H12 (k units)
Chart 21: Taiwan projected capacitive touch panel shipments, 1Q12-4Q12 (by area)
Chart 22: Global touch panel shipments, by manufacturing region, 1Q12-4Q12 (k units)
Chart 24: Global touch panel shipments, for handset applications, by technology, 1Q12-4Q12 (k units)
Chart 26: Global touch panel shipments, for tablet applications, by technology, 1Q12-4Q12 (k units)
Chart 27: Global touch panel shipments, by geographic region, 1Q12-4Q12 (k units)
