
With the solar PV market exhibiting strong growth in installations starting in the third quarter 2009, demand for PV inverters gradually began to outstrip supply. Demand remained tight throughout 2010, exacerbating the problem of inadequate supply, and the resulting shortfall in PV inverters became a bottleneck for system installation and grid connections. As a result, PV inverter manufacturers have actively expanded production capacity to address this situation, and capacity is estimated to have hit 40GW at the end of 2010.
The PV inverter market was originally dominated by Europe- and North America-based manufacturers, with Taiwan- and China-based firms shipping only small volumes of goods. However, faced with the prospect of shortfalls in supply during 2010, large numbers of orders were placed with Taiwan- and China-based manufacturers instead, leading to record order figures for many such firms. The profitability of PV inverters has also attracted a number of companies from power supply-related sectors to invest in R&D for PV inverters. In 2011, PV inverter products from as many as five to ten Taiwan-based firms new to the sector are predicted to be certified and start shipping; while more than one hundred China-based firms eager to take a slice of this lucrative market are projected to launch PV inverters this year.
PV inverters from Taiwan-based manufactures have already been granted power grid certification in many countries, with product quality reaching a high standard. Many China-based manufacturers' products have only been granted power grid certification in China, however, and the quality of many of their products still lags behind that of their Taiwan-based counterparts. Consequently, there are considerable differences between Taiwan and China-based manufacturers in terms of strategy, positioning and pricing.
Looking ahead, although the reduction of PV subsidies by governments including Germany, Italy, the Czech Republic and France will affect demand for installations in local markets, the rise of many emerging markets will sustain burgeoning demand for PV system installations. Digitimes Research forecasts that system installations will reach 22.4GWp in 2011, while shipments of PV inverters will hit 24.5GWp.
Chart 2: A photovoltaic inverter converts DC power to AC power
Chart 3: Operating mechanism of maximum power point tracking (MPPT)
Chart 7: Grid-tied PV inverters can be classified into three kinds according to power output
Chart 12: Delivery period for PV inverters, February-May 2010 (unit/week)
Chart 14: Global PV inverter production output, 2009-2010 (MWp)
Chart 15: PV inverter market, shipments and share by manufacturer, 2010 (GWp)
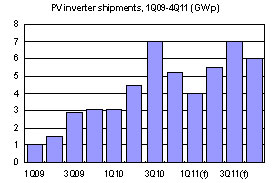
Chart 17: Trend for shipment of PV inverters, 2009-2011 (GWp)
Chart 18: Global PV inverter shipment trends, 2008-2012 (MWp)
Table 2: Global top ten manufacturers' capacity expansion plans, 2009-2011 (MWp)
Table 3: Production capacity for Germany's top ten manufacturers, 2009-2011 (MWp)
Table 4: Production capacity for Italy's top ten manufacturers, 2009-2011 (MWp)
Chart 20: PV price trends in Germany's end user market, 2010 (euro/W)
Table 7: Taiwan-based PV inverter manufacturers ranked by shipments
Chart 21: Comparison of PV inverter manufacturers' profit margins, 2Q09-3Q10
Chart 22: Taiwan-based PV inverter manufacturers' shipments, 2006-2011 (MWp)
Chart 23: Large numbers of new players join China PV inverter industry
Table 8: Capacity and shipment information for China-based PV-inverter firms (MW)
Chart 24: China-based PV inverter manufacturers' shipments, 2006-2011 (MWp)
Table 9: Prices of winning PV inverter bids for the Golden Sun Plan
Chart 26: European efficiency rates for PV inverters, 2005-2010
Table 10: Major PV inverter manufacturers' new 0-5kWp products
Table 11: Major PV inverter manufacturers' new 10-50kWp products
Chart 29: SMA global operations have allowed it to establish a complete service network
Chart 31: Quality as a key success factor in the PV inverter industry
Chart 32: Service as a key success factor in the PV inverter industry
Chart 33: Brands as a key success factor in the PV inverter industry
Chart 37: Major manufacturers are consolidating their operations in global markets
Chart 40: Comparison of the topology of micro inverters and traditional string inverters
Table 15: Manufacturers investing in micro inverter development
Chart 41: Series topology for fitting DC-DC power optimizers within systems
Chart 42: Power losses from shading can be massively reduced using SolarMagic
Chart 43: Parallel topology for fitting DC-DC power optimizers within systems
Chart 44: PV systems using parallel topologies can reduce power loss caused by shading
Chart 45: Power optimizers reduce the impact of shading, increasing power generation
Table 16: Manufacturers investing in power optimizer development
